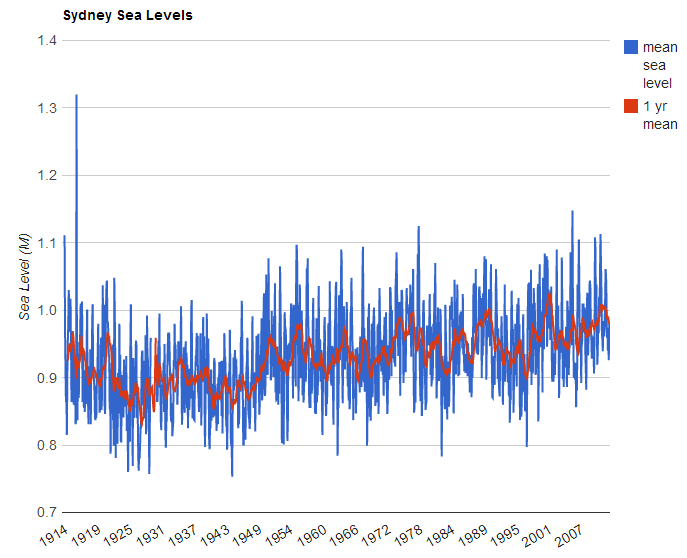
More data from the BOM, this time I’m plotting their historical tidal measurements along with moving averages over 6 months, 1 year, 5 years, 10 years and 30 years.
Tidal measurements are for Sydney taken from the Fort Denison gauge, the data includes monthly averages for low and high tides and the mean, going back to 1914.
Like the temperature data there are local rises and falls that last 10 years or more, but the consistent long term trend is up.
Click through to have a play with the chart, select the data sets you want and they will be displayed.
