Tag Archives: climate

Climate update

I’ve updated the climate pages with the latest data from the BOM.

If this summer felt long and hot to you then you’re right. The graph shows the average summer high is the hottest it’s been for 5 years. Looking at the 1 year averages the cooling trend that started in 2014 has reversed and we’re warming again. As always the longer term 30 year averages still show a very clear and consistent warming trend. The warming acceleration that started in 2013 is continuing.

Still no update from the BOM on sea level measurements, we’re stuck at the end of 2014 with that.

Rainfall data shows no clear long term trend, we’re pretty much smack in the middle of the historical long term measurements.
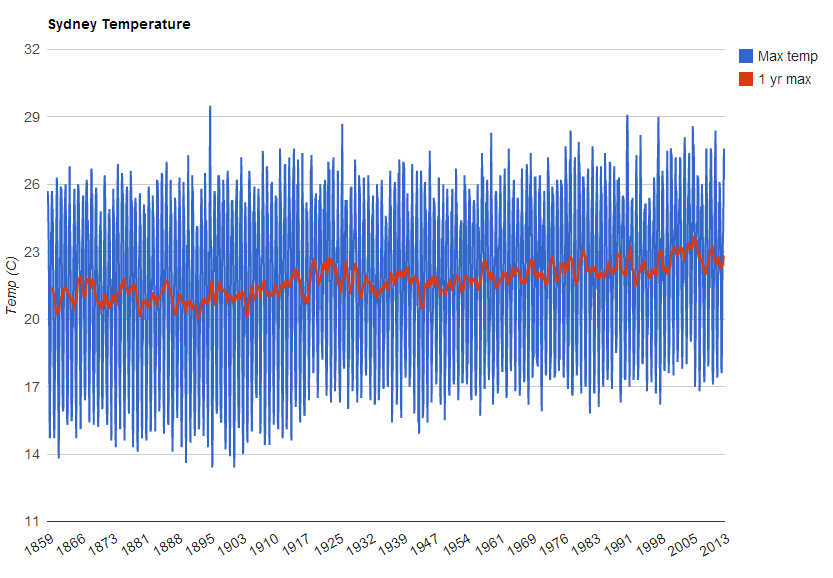
Sydney’s Changing Climate

Besides the boring old weather the Bureau of Meteorology website has a lot of pretty cool stuff. Something I’ve been digging into lately is their climate data. Depending on the weather station you can find rainfall, maximum and minimum temperatures going back over 150 years.

I’ve used their temperature data for the Observatory Hill station in Sydney to make a graph over time, I’ve also calculated moving averages over various time periods. It’s turned out some pretty interesting results. There’s a clear warming trend since the early 1900’s for maximum temps and around the mid 1940’s for minimums, but it’s not all smooth, there have been some ups and downs that have lasted over 10 years.

Click through to the interactive graph and have a play, you can turn the various data series on and off to compare. You have to be a bit patient, it can take a few seconds after you click to send through the new data points and graph them.

The change in maximum Sydney temperatures over time